What is multi-echo fMRI?
Most echo-planar image (EPI) sequences collect a single brain image following a radio frequency (RF) pulse, at a rate known as the repetition time (TR). This typical approach is known as single-echo fMRI. In contrast, multi-echo (ME) fMRI refers to collecting data at multiple echo times, resulting in multiple volumes with varying levels of contrast acquired per RF pulse.
The physics of multi-echo fMRI
Multi-echo fMRI data is obtained by acquiring multiple echo times (commonly called TEs) for each MRI volume during data collection. While fMRI signal contains important neural information (termed the blood oxygen-level dependent, or BOLD signal, it also contains “noise” (termed non-BOLD signal) caused by things like participant motion and changes in breathing. Because the BOLD signal is known to decay at a set rate, collecting multiple echos allows us to assess non-BOLD.
The image below shows the basic relationship between echo times and the image acquired at 3T (top, A) and 7T (bottom, B). Note that the earliest echo time is the brightest, as the signal has only had a limited amount of time to decay. In addition, the latter echo times show areas in which is the signal has decayed completely (‘drop out’) due to inhomogeneity in the magnetic field. By using the information across multiple echoes these images can be combined in an optimal manner to take advantage of the signal in the earlier echoes (see Optimal combination).
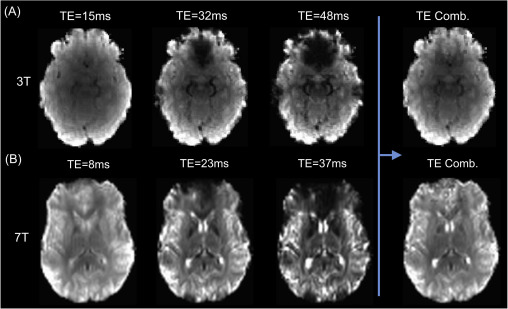
Adapted from Kundu et al. (2017).
In order to classify the relationship between the signal and the echo time we can consider a
single voxel at two timepoints (x and y) and the measured signal measured at three different echo times -  .
.
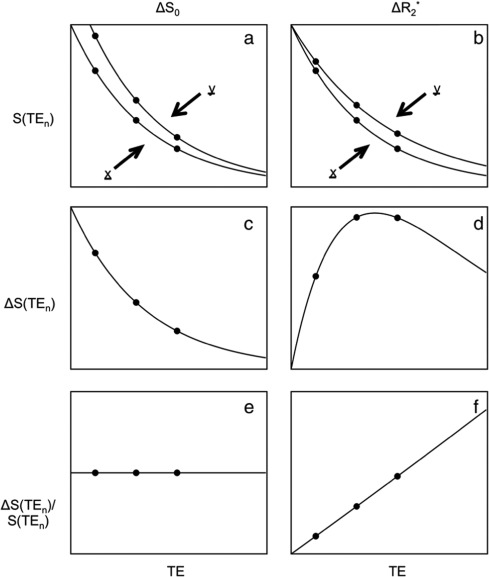
Adapted from Kundu et al. (2017).
For the left column, we are observing a change that we term  - that is a change
in the intercept or raw signal intensity.
A common example of this is participant movement, in which the voxel (which is at a static
location within the scanner) now contains different tissue or even an area outside of the brain.
- that is a change
in the intercept or raw signal intensity.
A common example of this is participant movement, in which the voxel (which is at a static
location within the scanner) now contains different tissue or even an area outside of the brain.
As we have collected three separate echoes, we can compare the change in signal at each echo time,  .
For we see that this produces a decaying curve.
If we compare this to the original signal, as in
.
For we see that this produces a decaying curve.
If we compare this to the original signal, as in  we see that there is no echo time dependence, as the final plot is a flat line.
In the right column, we consider changes that are related to brain activity.
For example, imagine that the two brain states here (x and y) are a baseline and task activated state respectively.
This effect is a change in in  which is equivalent
to the inverse of
which is equivalent
to the inverse of  .
We typically observe this change in signal amplitude occurring over volumes with
the hemodynamic response, while here we are examining the change in signal over echo times.
Again we can plot the difference in the signal between these two states as a function of echo time,
finding that the signal rises and falls.
If we compare this curve to the original signal we find
that the magnitude of the changes is dependent on the echo time.
.
We typically observe this change in signal amplitude occurring over volumes with
the hemodynamic response, while here we are examining the change in signal over echo times.
Again we can plot the difference in the signal between these two states as a function of echo time,
finding that the signal rises and falls.
If we compare this curve to the original signal we find
that the magnitude of the changes is dependent on the echo time.
For a more comprehensive review of these topics and others, see Kundu et al. (2017).
Why use multi-echo?
There are many potential reasons an investigator would be interested in using multi-echo EPI (ME-EPI). Among these are the different levels of analysis ME-EPI enables. Specifically, by collecting multi-echo data, researchers are able to:
Compare results across different echoes: currently, field standards are largely set using single-echo EPI. Because multi-echo is composed of multiple single-echo time series, each of these can be analyzed separately and compared to one another.
Combine the results by weighted averaging: Rather than analyzing single-echo time series separately, we can combine them into an “optimally combined time series”. For more information on this combination, see Optimal combination. Optimally combined data exhibits higher SNR and improves statistical power of analyses in regions traditionally affected by drop-out.
Denoise the data based on information contained in the echoes: Collecting multi-echo data allows access to unique denoising methods. ICA-based denoising methods like ICA-AROMA (Pruim et al. (2015)) have been shown to significantly improve the quality of cleaned signal. These methods, however, have comparably limited information, as they are designed to work with single-echo EPI.
tedana is an ICA-based denoising pipeline built especially for
multi-echo data. Collecting multi-echo EPI allows us to leverage all of the information available for single-echo datasets,
as well as additional information only available when looking at signal decay across multiple TEs.
We can use this information to denoise the optimally combined time series.
Considerations for ME-fMRI
Multi-echo fMRI acquisition sequences and analysis methods are rapidly maturing. Someone who has access to a multi-echo fMRI sequence should seriously consider using it.
Costs and benefits of multi-echo fMRI
The following are a few points to consider when deciding whether or not to collect multi-echo data.
Possible increase in TR
The one difference with multi-echo is a slight time cost. For multi-echo fMRI, the shortest echo time (TE) is essentially free since it is collected in the gap between the RF pulse and the single-echo acquisition. The second echo tends to roughly match the single-echo TE. Additional echoes require more time. For example, on a 3T MRI, if the T2* weighted TE is 30ms for single echo fMRI, a multi-echo sequence may have TEs of 15.4, 29.7, and 44.0ms. In this example, the extra 14ms of acquisition time per RF pulse is the cost of multi-echo fMRI.
One way to think about this cost is in comparison to single-echo fMRI. If a multi-echo sequence has identical spatial resolution and acceleration as a single-echo sequence, then a rough rule of thumb is that the multi-echo sequence will have 10% fewer slices or 10% longer TR. Instead of compromising on slice coverage or TR, one can increase acceleration. If one increases acceleration, it is worth doing an empirical comparison to make sure there isn’t a non-trivial loss in SNR or an increase of artifacts.
Weighted averaging may lead to an increase in SNR
Multiple studies have shown that a weighted average of the echoes to optimize
T2* weighting, sometimes called “optimally combined,” gives a reliable, modest
boost in data quality.
The optimal combination of echoes can currently be calculated in several
software packages including AFNI, fMRIPrep, and tedana.
In tedana, the weighted average can be calculated with
tedana.workflows.t2smap_workflow().
If no other acquisition compromises are necessary to acquire multi-echo data,
this boost is worthwhile.
Consider the life of the dataset
If other compromises are necessary, consider the life of the data set. If data is being acquired for a discrete study that will be acquired, analyzed, and published in a year or two, it might not be worth making compromises to acquire multi-echo data. If a data set is expected to be used for future analyses in later years, it is likely that more powerful approaches to multi-echo denoising will sufficiently mature and add even more value to a data set.
Other multi-echo denoising methods, such as MEICA, the predecessor to tedana, have shown the potential for much greater data quality improvements, as well as the ability to more accurately separate visually similar signal vs noise, such as scanner based drifts vs slow changes in BOLD signal. More powerful methods and associated algorithms are still being actively developed. Users need to have the time and knowledge to look at the denoising output from every run to make sure denoising worked as intended.
You may recover signal in areas affected by dropout
Typical single echo fMRI uses an echo time that is appropriate for signal
across most of the brain.
While this is effective, it also leads to drop out in regions with low
 values.
This can lead to low or even no signal at all in some areas.
If your research question could benefit from having improved signal
characteristics in regions such as the orbitofrontal cortex, ventral temporal
cortex or the ventral striatum then multi-echo fMRI may be beneficial.
values.
This can lead to low or even no signal at all in some areas.
If your research question could benefit from having improved signal
characteristics in regions such as the orbitofrontal cortex, ventral temporal
cortex or the ventral striatum then multi-echo fMRI may be beneficial.
Consider the cost of added quality control
The developers of tedana strongly support always examining data for quality
concerns, whether or not multi-echo fMRI is used.
Multi-echo data and denoising are no exception.
For this purpose, tedana currently produces basic diagnostic images by
default, which can be inspected in order to determine the quality of denoising.
See Outputs of tedana for more information on these outputs.