About multi-echo fMRI
What is multi-echo fMRI?
Most echo-planar image (EPI) sequences collect a single brain image following a radio frequency (RF) pulse, at a rate known as the repetition time (TR). This typical approach is known as single-echo fMRI. In contrast, multi-echo (ME) fMRI refers to collecting data at multiple echo times, resulting in multiple volumes with varying levels of contrast acquired per RF pulse.
The physics of multi-echo fMRI
Multi-echo fMRI data is obtained by acquiring multiple echo times (commonly called TEs) for each MRI volume during data collection. While fMRI signal contains important neural information (termed the blood oxygen-level dependent, or BOLD signal, it also contains “noise” (termed non-BOLD signal) caused by things like participant motion and changes in breathing. Because the BOLD signal is known to decay at a set rate, collecting multiple echos allows us to assess non-BOLD.
The image below shows the basic relationship between echo times and the image acquired at 3T (top, A) and 7T (bottom, B). Note that the earliest echo time is the brightest, as the signal has only had a limited amount of time to decay. In addition, the latter echo times show areas in which is the signal has decayed completely (‘drop out’) due to inhomogeneity in the magnetic field. By using the information across multiple echoes these images can be combined in an optimal manner to take advantage of the signal in the earlier echoes (see Optimal combination).
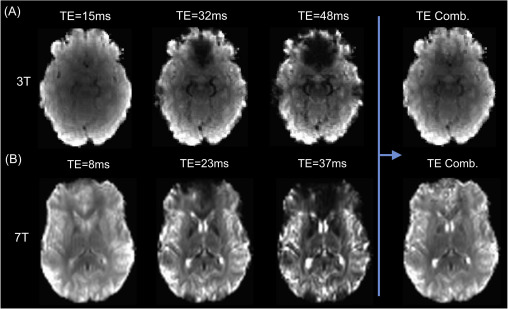
Adapted from Kundu et al. (2017).
In order to classify the relationship between the signal and the echo time we can consider a
single voxel at two timepoints (x and y) and the measured signal measured at three different echo times -  .
.
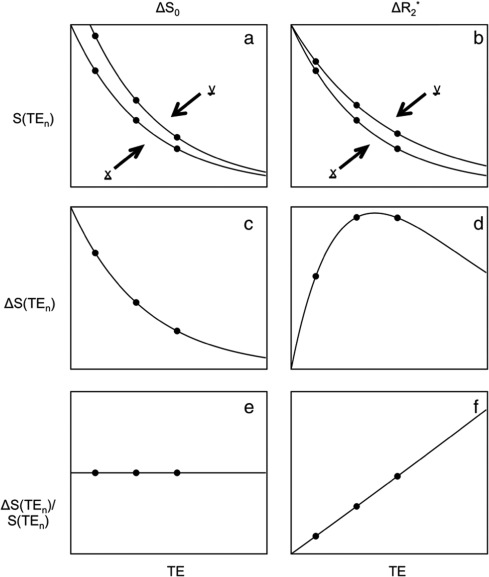
Adapted from Kundu et al. (2017).
For the left column, we are observing a change that we term  - that is a change
in the intercept or raw signal intensity.
A common example of this is participant movement, in which the voxel (which is at a static
location within the scanner) now contains different tissue or even an area outside of the brain.
- that is a change
in the intercept or raw signal intensity.
A common example of this is participant movement, in which the voxel (which is at a static
location within the scanner) now contains different tissue or even an area outside of the brain.
As we have collected three separate echoes, we can compare the change in signal at each echo time,  .
For we see that this produces a decaying curve.
If we compare this to the original signal, as in
.
For we see that this produces a decaying curve.
If we compare this to the original signal, as in  we see that there is no echo time dependence, as the final plot is a flat line.
In the right column, we consider changes that are related to brain activity.
For example, imagine that the two brain states here (x and y) are a baseline and task activated state respectively.
This effect is a change in in  which is equivalent
to the inverse of
which is equivalent
to the inverse of  .
We typically observe this change in signal amplitude occurring over volumes with
the hemodynamic response, while here we are examining the change in signal over echo times.
Again we can plot the difference in the signal between these two states as a function of echo time,
finding that the signal rises and falls.
If we compare this curve to the original signal we find
that the magnitude of the changes is dependent on the echo time.
.
We typically observe this change in signal amplitude occurring over volumes with
the hemodynamic response, while here we are examining the change in signal over echo times.
Again we can plot the difference in the signal between these two states as a function of echo time,
finding that the signal rises and falls.
If we compare this curve to the original signal we find
that the magnitude of the changes is dependent on the echo time.
For a more comprehensive review of these topics and others, see Kundu et al. (2017).
Why use multi-echo?
There are many potential reasons an investigator would be interested in using multi-echo EPI (ME-EPI). Among these are the different levels of analysis ME-EPI enables. Specifically, by collecting multi-echo data, researchers are able to:
Compare results across different echoes: currently, field standards are largely set using single-echo EPI. Because multi-echo is composed of multiple single-echo time series, each of these can be analyzed separately and compared to one another.
Combine the results by weighted averaging: Rather than analyzing single-echo time series separately, we can combine them into an “optimally combined time series”. For more information on this combination, see Optimal combination. Optimally combined data exhibits higher SNR and improves statistical power of analyses in regions traditionally affected by drop-out.
Denoise the data based on information contained in the echoes: Collecting multi-echo data allows access to unique denoising methods. ICA-based denoising methods like ICA-AROMA (Pruim et al. (2015)) have been shown to significantly improve the quality of cleaned signal. These methods, however, have comparably limited information, as they are designed to work with single-echo EPI.
tedana is an ICA-based denoising pipeline built especially for
multi-echo data. Collecting multi-echo EPI allows us to leverage all of the information available for single-echo datasets,
as well as additional information only available when looking at signal decay across multiple TEs.
We can use this information to denoise the optimally combined time series.
Considerations for ME-fMRI
Multi-echo fMRI acquisition sequences and analysis methods are rapidly maturing. Someone who has access to a multi-echo fMRI sequence should seriously consider using it.
Costs and benefits of multi-echo fMRI
The following are a few points to consider when deciding whether or not to collect multi-echo data.
Possible increase in TR
The one difference with multi-echo is a slight time cost. For multi-echo fMRI, the shortest echo time (TE) is essentially free since it is collected in the gap between the RF pulse and the single-echo acquisition. The second echo tends to roughly match the single-echo TE. Additional echoes require more time. For example, on a 3T MRI, if the T2* weighted TE is 30ms for single echo fMRI, a multi-echo sequence may have TEs of 15.4, 29.7, and 44.0ms. In this example, the extra 14ms of acquisition time per RF pulse is the cost of multi-echo fMRI.
One way to think about this cost is in comparison to single-echo fMRI. If a multi-echo sequence has identical spatial resolution and acceleration as a single-echo sequence, then a rough rule of thumb is that the multi-echo sequence will have 10% fewer slices or 10% longer TR. Instead of compromising on slice coverage or TR, one can increase acceleration. If one increases acceleration, it is worth doing an empirical comparison to make sure there isn’t a non-trivial loss in SNR or an increase of artifacts.
Weighted averaging may lead to an increase in SNR
Multiple studies have shown that a weighted average of the echoes to optimize
T2* weighting, sometimes called “optimally combined,” gives a reliable, modest
boost in data quality.
The optimal combination of echoes can currently be calculated in several
software packages including AFNI, fMRIPrep, and tedana.
In tedana, the weighted average can be calculated with
tedana.workflows.t2smap_workflow().
If no other acquisition compromises are necessary to acquire multi-echo data,
this boost is worthwhile.
Consider the life of the dataset
If other compromises are necessary, consider the life of the data set. If data is being acquired for a discrete study that will be acquired, analyzed, and published in a year or two, it might not be worth making compromises to acquire multi-echo data. If a data set is expected to be used for future analyses in later years, it is likely that more powerful approaches to multi-echo denoising will sufficiently mature and add even more value to a data set.
Other multi-echo denoising methods, such as MEICA, the predecessor to tedana, have shown the potential for much greater data quality improvements, as well as the ability to more accurately separate visually similar signal vs noise, such as scanner based drifts vs slow changes in BOLD signal. More powerful methods and associated algorithms are still being actively developed. Users need to have the time and knowledge to look at the denoising output from every run to make sure denoising worked as intended.
You may recover signal in areas affected by dropout
Typical single echo fMRI uses an echo time that is appropriate for signal
across most of the brain.
While this is effective, it also leads to drop out in regions with low
 values.
This can lead to low or even no signal at all in some areas.
If your research question could benefit from having improved signal
characteristics in regions such as the orbitofrontal cortex, ventral temporal
cortex or the ventral striatum then multi-echo fMRI may be beneficial.
values.
This can lead to low or even no signal at all in some areas.
If your research question could benefit from having improved signal
characteristics in regions such as the orbitofrontal cortex, ventral temporal
cortex or the ventral striatum then multi-echo fMRI may be beneficial.
Consider the cost of added quality control
The developers of tedana strongly support always examining data for quality
concerns, whether or not multi-echo fMRI is used.
Multi-echo data and denoising are no exception.
For this purpose, tedana currently produces basic diagnostic images by
default, which can be inspected in order to determine the quality of denoising.
See Outputs of tedana for more information on these outputs.
Acquiring multi-echo data
Available multi-echo fMRI sequences
We have attempted to compile some basic multi-echo fMRI protocols in an OSF project. The parameter choices in these protocols run and seem reasonable, but they have not been optimized for a specific situation. They are a good starting point for someone designing a study, but should not be considered canonical. If you would like to use one of them, please customize it for your own purposes and make sure to run pilot scans to test your choices.
Siemens
For Siemens users, there are two options for Works In Progress (WIPs) Sequences.
- The Center for Magnetic Resonance Research at the University of Minnesotaprovides a custom MR sequence that allows users to collect multiple echoes(termed Contrasts). The sequence and documentation can be found here.For details on obtaining a license follow this link.By default the number of contrasts is 1, yielding a single-echo sequence.In order to collect multiple echoes, increase number of Contrasts on theSequence Tab, Part 1 on the MR console.
- The Martinos Center at Harvard also has a MR sequence available, with thedetails available here. The number of echoes can be specified on theSequence, Special tab in this sequence.
GE
For GE users, there are currently two sharable pulse sequences:
Multi-echo EPI (MEPI) – Software releases: DV24, MP24 and DV25 (with offline recon)
- Hyperband Multi-echo EPI (HyperMEPI) - Software releases: DV26, MP26, DV27, RX27(here hyperband can be deactivated to do simple Multi-echo EPI – online recon)
Please reach out to the GE Research Operation team or each pulse sequence’s author to begin the process of obtaining this software. More information can be found on the GE Collaboration Portal
Once logged in, go to Groups > GE Works-in-Progress you can find the description of the current ATSM (i.e. prototypes).
Philips
For Philips users, sequences can be defined using product software.
Multi-echo EPI (ME-EPI) can be acquired using the product software and can be combined with SENSE parallel imaging and MultiBand. The combination with MultiBand requires a SW release >R5.1 and MultiBand functionality to be present. No default ME-EPI are provided, but existing single-echo EPI sequences from the BOLD fMRI folder can be modified into multi-echo sequences by increasing the number of echoes. As a starting point to develop a 3 echo EPI protocol start by opening the default fMRI protocol and modify the following: increase number of echoes to 3 on the Contrast tab, set SENSE = 3, MB-SENSE = 3, set to 3mm isotropic voxels and adjust TEs to your preference.
Other available multi-echo MRI sequences
In addition to ME-fMRI, other MR sequences benefit from acquiring multiple echoes, including T1-weighted imaging (MEMPRAGE) and susceptibility weighted imaging. While most of these kinds of sequences fall outside the purview of this documentation, quantitative T2* mapping is relevant since a baseline T2* map is used in several processing steps including Optimal combination. While the T2* map estimated directly from fMRI time series is noisy, no current study quantifies the benefit to optimal combination or tedana denoising if a higher quality T2* map is used. Some benefit is likely, so, if a T2* map is independently calculated, it can be used as an input to many functions in the tedana workflow.
Warning
While tedana allows the input of a T2* map from any source, and a more accurate T2* map should lead to better results, this hasn’t been systematically evaluated yet.
There are many ways to calculate T2* maps, with some using multi-echo acquisitions. We are not presenting an expansive review of this literature here, but Cohen-Adad et al. (2012) and Ruuth et al. (2019) are good places to start learning more about this topic.
Acquisition parameter recommendations
There is no empirically tested best parameter set for multi-echo fMRI acquisition. The guidelines for optimizing parameters are similar to single-echo fMRI. For multi-echo fMRI, the same factors that may guide priorities for single echo fMRI sequences are also relevant. Choose sequence parameters that meet the priorities of a study with regards to spatial resolution, spatial coverage, sample rate, signal-to-noise ratio, signal drop-out, distortion, and artifacts.
A minimum of 3 echoes is required for running the current implementation fo TE-dependent denoising in
tedana.
It may be useful to have at least one echo that is earlier and one echo that is later than the
TE one would use for single-echo T2* weighted fMRI.
Note
This is in contrast to the dual echo denoising method which uses a very early (~5ms) first echo in order to clean data. For more information on this method, see Bright and Murphy (2013).
More than 3 echoes may be useful, because that would allow for more accurate estimates of BOLD and non-BOLD weighted fluctuations, but more echoes have an additional time cost, which would result in either less spatiotemporal coverage or more acceleration. Where the benefits of more echoes balance out the additional costs is an open research question.
We are not recommending specific parameter options at this time. There are multiple ways to balance the slight time cost from the added echoes that have resulted in research publications. We suggest new multi-echo fMRI users examine the Publications using multi-echo fMRI that use multi-echo fMRI to identify studies with similar acquisition priorities, and use the parameters from those studies as a starting point. More complete recommendations and guidelines are discussed in the appendix of Dipasquale et al. (2017).
Note
In order to increase the number of contrasts (“echoes”) you may need to first increase the TR, shorten the first TE and/or enable in-plane acceleration. For typically used parameters see the ME-fMRI parameters section below.
ME-fMRI parameters
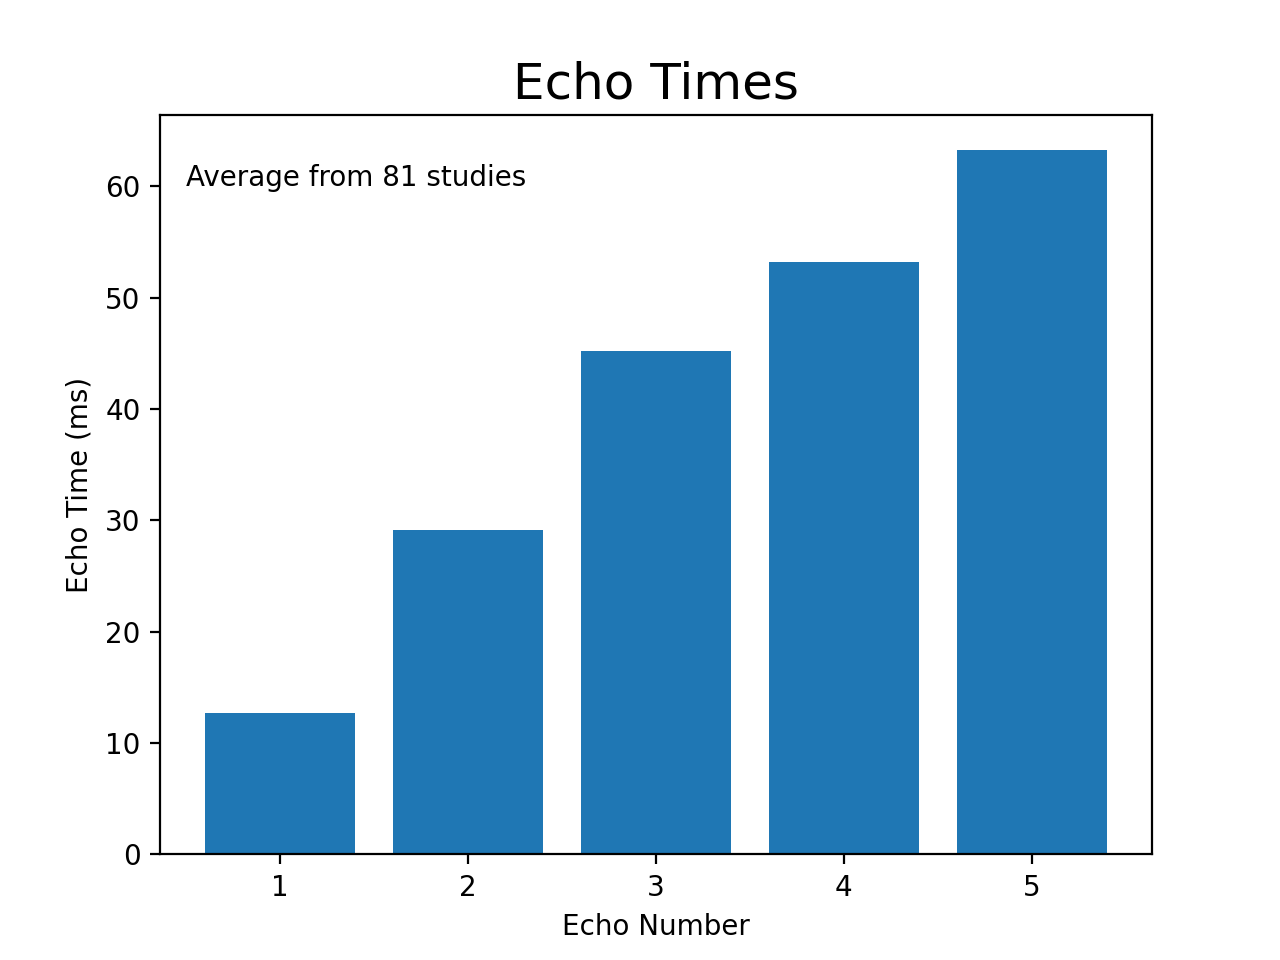
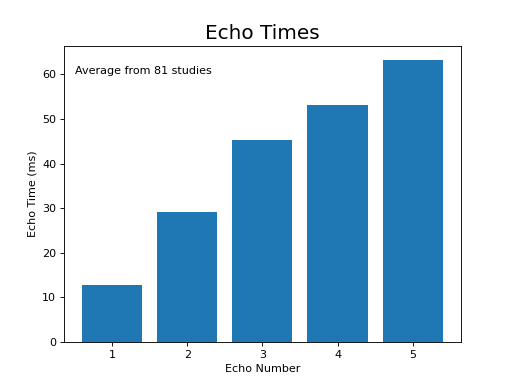
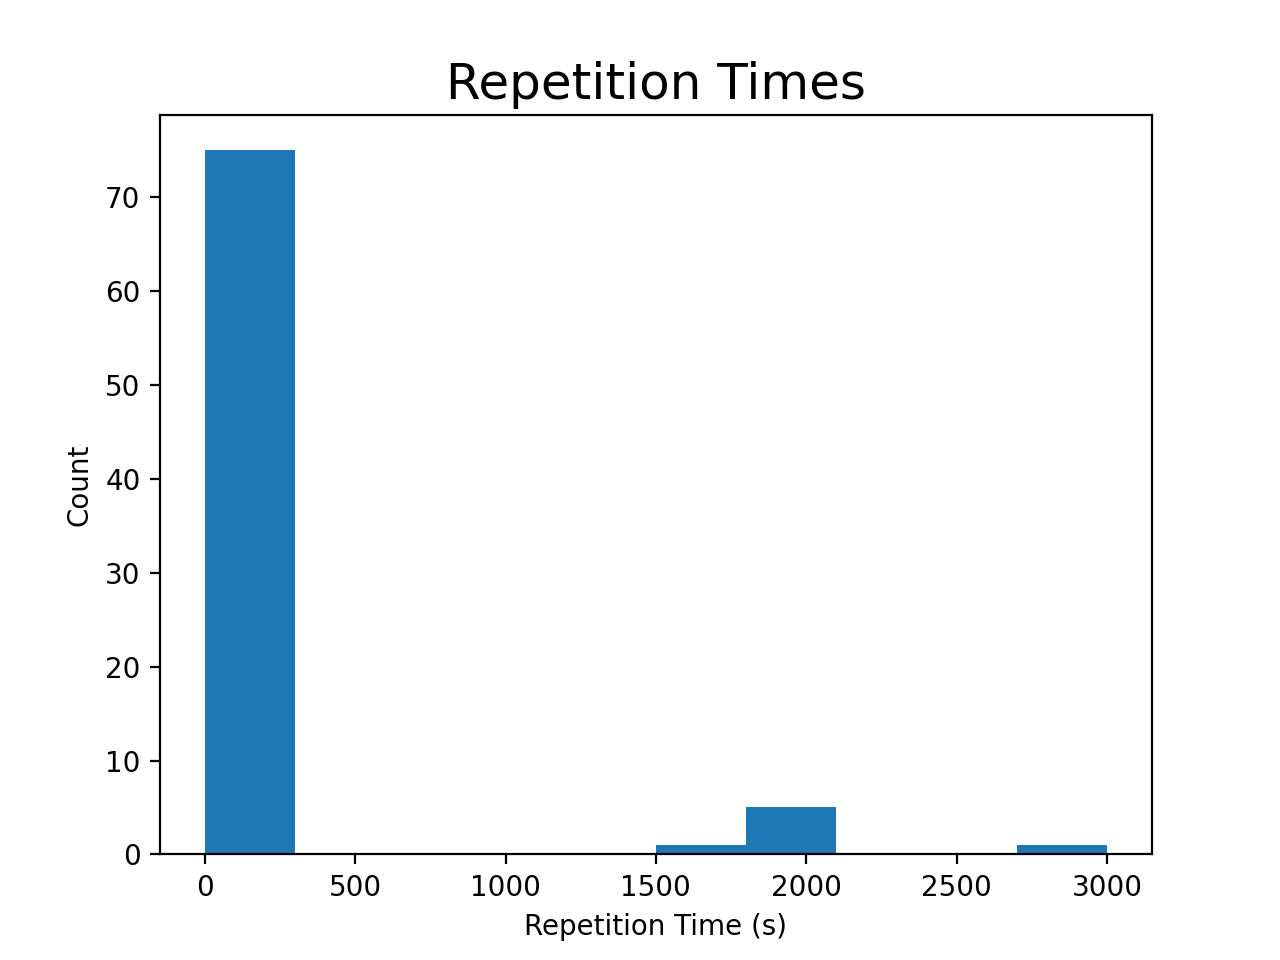
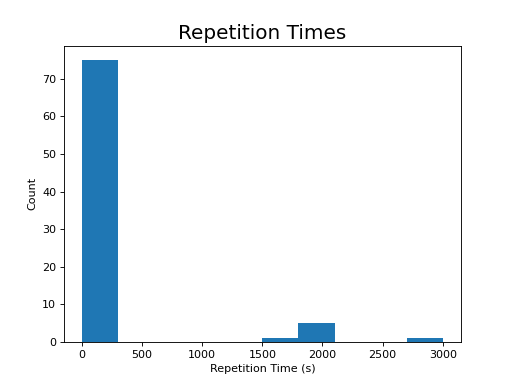
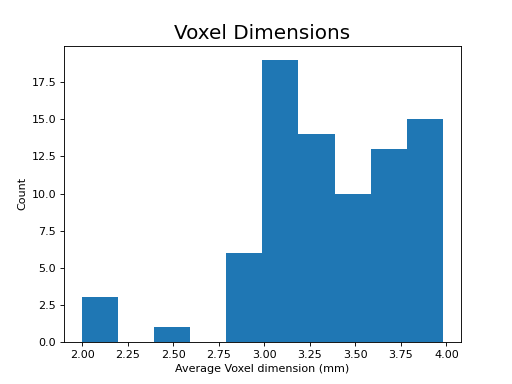
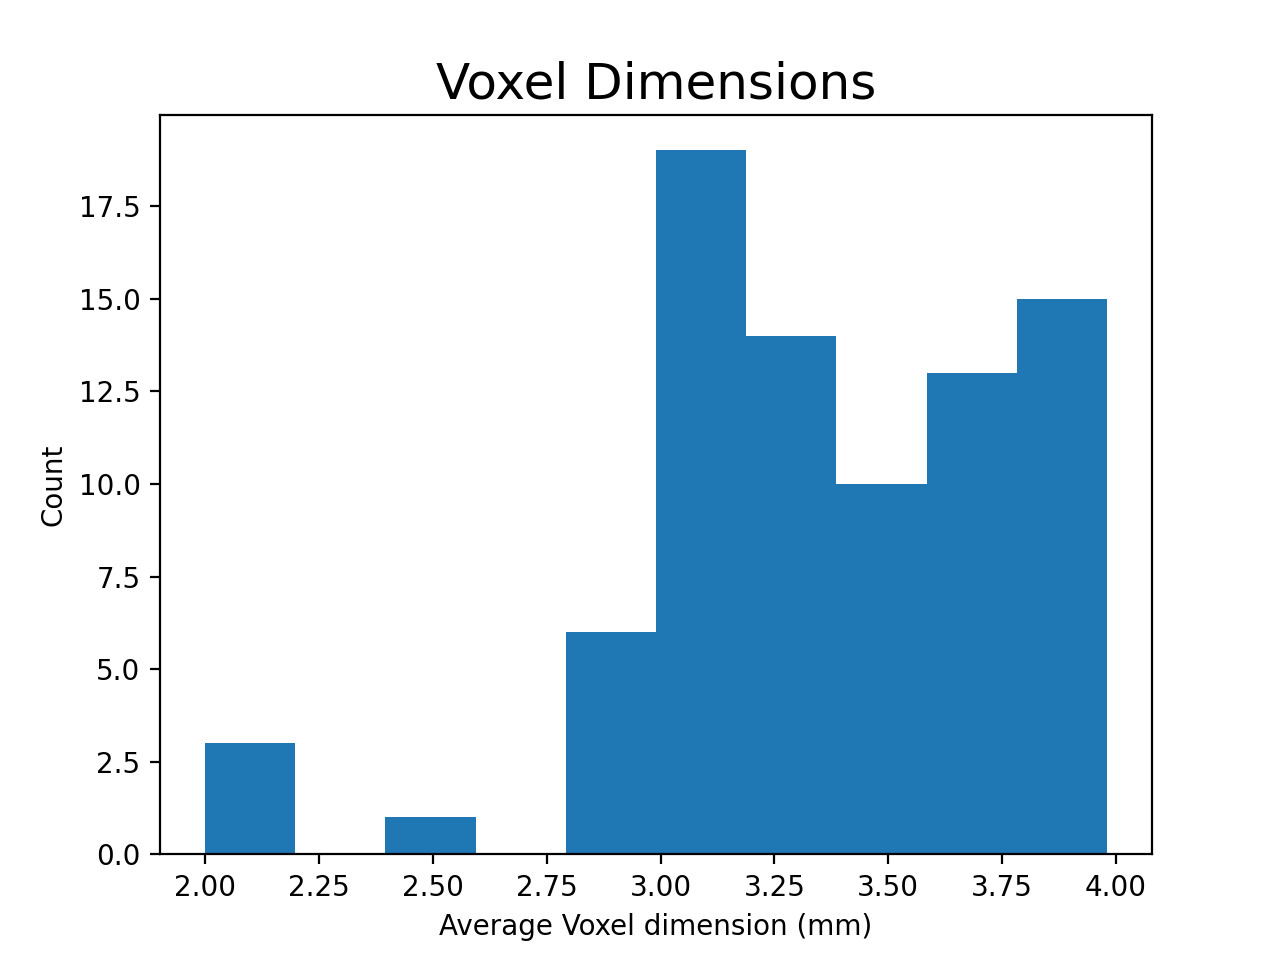
The following section highlights a selection of parameters collected from published papers that have used multi-echo fMRI. You can see the spreadsheet of publications at Publications using multi-echo fMRI.
The following plots reflect the average values for studies conducted at 3 Tesla.
(Source code, png, hires.png, pdf)

Processing multi-echo fMRI
Most multi-echo denoising methods, including tedana,
must be called in the context of a larger ME-EPI preprocessing pipeline.
Two common pipelines which support ME-EPI processing include fMRIPrep and afni_proc.py.
Users can also construct their own preprocessing pipeline for ME-EPI data from which to call the multi-echo denoising method of their choice. There are several general principles to keep in mind when constructing ME-EPI processing pipelines.
In general, we recommend the following:
1. Estimate motion correction parameters from one echo and apply those parameters to all echoes
When preparing ME-EPI data for multi-echo denoising with a tool like tedana,
it is important not to do anything that mean shifts the data or otherwise separately
scales the voxelwise values at each echo.
For example, head-motion correction parameters should not be calculated and applied at an individual echo level (see above). Instead, we recommend that researchers apply the same transforms to all echoes in an ME-EPI series. That is, that they calculate head motion correction parameters from one echo and apply the resulting transformation to all echoes.
2. Perform slice timing correction and motion correction before multi-echo denoising
Similarly to single-echo EPI data, slice time correction allows us to assume that voxels across
slices represent roughly simultaneous events.
If the TR is slow enough to necessitate slice-timing (i.e., TR >= 1 sec., as a rule of thumb), then
slice-timing correction should be done before tedana.
This is because slice timing differences may impact echo-dependent estimates.
The slice time is generally defined as the excitation pulse time for each slice. For single-echo EPI data, that excitation time would be the same regardless of the echo time, and the same is true when one is collecting multiple echoes after a single excitation pulse. Therefore, we suggest using the same slice timing for all echoes in an ME-EPI series.
3. Apply spatial normalization and susceptibility distortion correction consistently across echoes
One key feature of susceptibility distortion is that it is primarily a factor of readout pattern and total readout time, rather than echo time. This means that, for most multi-echo sequences, even though dropout will increase with echo time, distortion will not (at least not to a noticeable/meaningful extent).
For this reason, if you are applying TOPUP-style (blip-up/blip-down) “field maps”, we recommend using your first echo time, as this will exhibit the least dropout. If your first echo time is very short, and exhibits poor gray/white contrast, then a later echo time may be preferable. In any case, you should calculate the spatial transform from just one of your echoes and apply it across all of them.
Similarly, if spatial normalization to a template is done, the spatial transform should be calculated once and the same transformation (ideally one transformation for motion correction, distortion correction, and spatial normalization) should be applied to all echoes.
4. Perform smoothing, and any rescaling or filtering after denoising
Any step that will alter the relationship of signal magnitudes between echoes should occur after denoising and combining
of the echoes. For example, if echo is separately scaled by its mean signal over time, then resulting intensity gradients
and the subsequent calculation of voxelwise T2* values will be distorted or incorrect. See the description of
tedana’s approach for more details on how T2* values are calculated. An agressive temporal filter
(i.e. a 0.1Hz low pass filter) or spatial smoothing could similarly distort the relationship between the echoes at each
time point.
Note
Spatial normalization and distortion correction, particularly non-linear normalization methods with higher order interpolation functions to regrid voxels in a new space, may distort the relationship between echoes more than bilinear interpolation. This has the potential to distort the relationship between echoes and there have been anecdotal cases where this might be an issue. Still, since serial spatial transforms spatially smooth the data and most modern pipeline combine all spatial transforms into a single step, we recommend doing these steps before running denoising. Particularly for data with high intensity heterogeneity between the surface and center of the brain, we recommend checking if distoration correction and normalization adversely affect the relationship between echoes.
General Resources
Journal articles describing multi-echo methods
- Publications using multi-echo fMRI catalogues papers using multi-echo fMRI,with information about acquisition parameters.
- Posse, NeuroImage 2012Includes an historical overview of multi-echo acquisition and research
- Kundu et al, NeuroImage 2017A review of multi-echo denoising with a focus on the MEICA algorithm
- Olafsson et al, NeuroImage 2015The appendix includes a good explanation of the math underlying MEICA denoising
- Dipasquale et al, PLoS One 2017The appendix includes some recommendations for multi-echo acquisition
Videos
An educational session from OHBM 2017 by Dr. Prantik Kundu about multi-echo denoising
A series of lectures from the OHBM 2017 multi-echo session on multiple facets of multi-echo data analysis
- Multi-echo fMRI lecture from the 2018 NIH FMRI Summer Course by Javier Gonzalez-Castillo
NIMH Center for Multimodal Neuroimaging Advantages of multi-echo fMRI (2019) by Dan Handwerker, Javier Gonzalez-Castillo, and Vinai Roopchansingh
- MRI Together 2022 Conference Presentations by Eneko UruñuelaA tour of tedana (tour recording, tour slides)
Multi-echo preprocessing software
tedana requires data that has already been preprocessed for head motion, alignment, etc.
AFNI can process multi-echo data natively as well as apply tedana denoising through the use of afni_proc.py. To see various implementations, start with Example 12 in the afni_proc.py help
fmriprep can also process multi-echo data, but is currently limited to using the optimally combined timeseries. For more details, see the fmriprep workflows page and [tedana] How do I use tedana with fMRIPrepped data?.
fmrwhy runs BIDS-compatible fMRI analysis with SPM12 and supports multi-echo data, but it is no longer being actively maintained.
Currently SPM and FSL do not natively support multi-echo fmri data processing.
Other software that uses multi-echo fMRI
tedana represents only one approach to processing multi-echo data.
Currently there are a number of methods that can take advantage of or use the
information contained in multi-echo data.
These include:
- 3dMEPFM: A multi-echo implementation of ‘paradigm free mapping’, that isdetection of neural events in the absence of a prespecified model. Byleveraging the information present in multi-echo data, changes in relaxationtime can be directly estimated and more events can be detected.For more information, see the following paper.
- Bayesian approach to denoising: An alternative approach to separating outBOLD and non-BOLD signals within a Bayesian framework is currently underdevelopment.
- Multi-echo Group ICA: Current approaches to ICA just use a single run ofdata in order to perform denoising. An alternative approach is to useinformation from multiple subjects or multiple runs from a single subjectin order to improve the classification of BOLD and non-BOLD components.
- Dual Echo Denoising: If the first echo can be collected early enough,there are currently methods that take advantage of the very limited BOLDweighting at these early echo times.
- qMRLab: This is a MATLAB software package for quantitative magneticresonance imaging. While it does not support ME-fMRI, it does include methodsfor estimating T2*/S0 from high-resolution, complex-valued multi-echo GREdata with correction for background field gradients.
Datasets
A number of multi-echo datasets have been made public so far. This list is not necessarily up to date, so please check out OpenNeuro to potentially find more.
Multiband multi-echo simultaneous ASL/BOLD for task-induced functional MRI
Evidence supporting a time-limited hippocampal role in retrieving autobiographical memories
Heart rate variability biofeedback training and emotion regulation
A mesial-to-lateral dissociation for orthographic processing in the visual cortex (dual-echo)
Publications using multi-echo fMRI
The sheet at the bottom of this page contains an extensive list of multi-echo fMRI publications. You can view and suggest additions to this spreadsheet here. This is a volunteer-led effort so, if you know of a excluded publication, whether or not it is yours, please add it.
Interactive visualizations of publications and parameters
You can explore interactive and accessible information about multi-echo studies from the list of publications below, their study design parameters, and MRI sequence parameter options using this web application. If you’d like to add more studies, parameters or visualization options to the application, feel free to create an issue or send a pull request on the application’s GitHub repository.